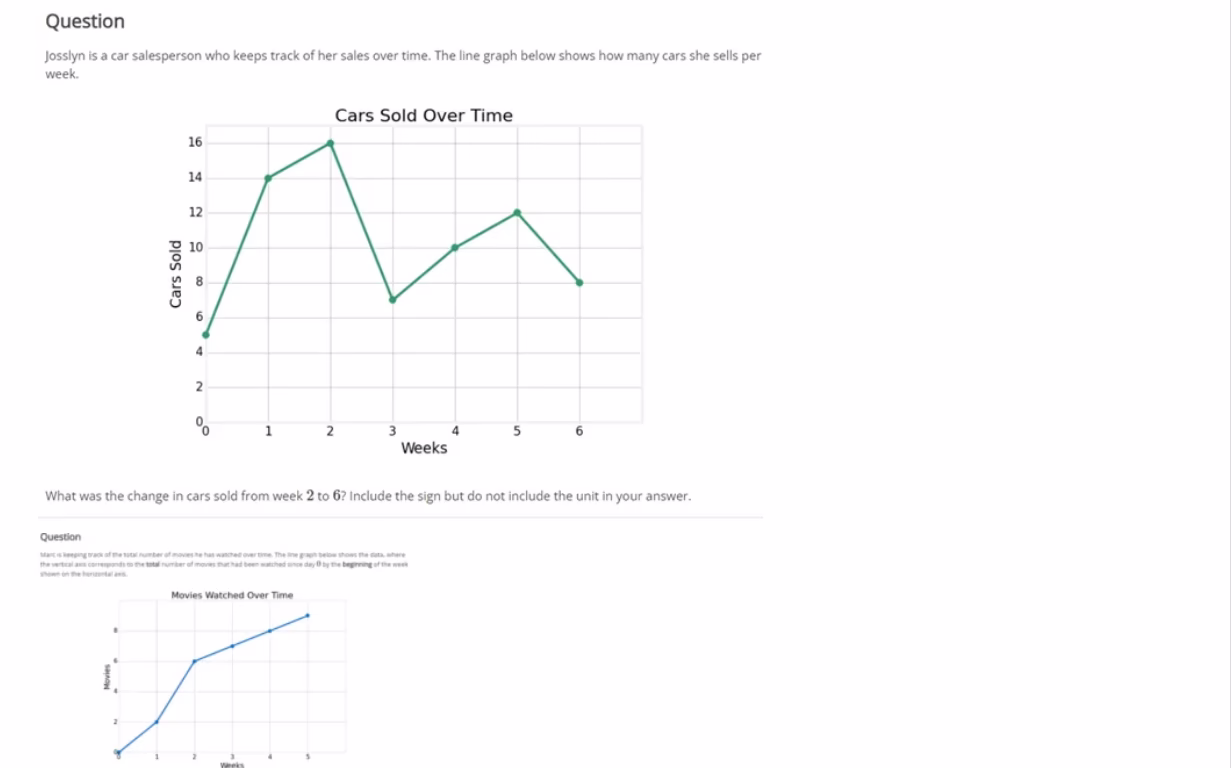
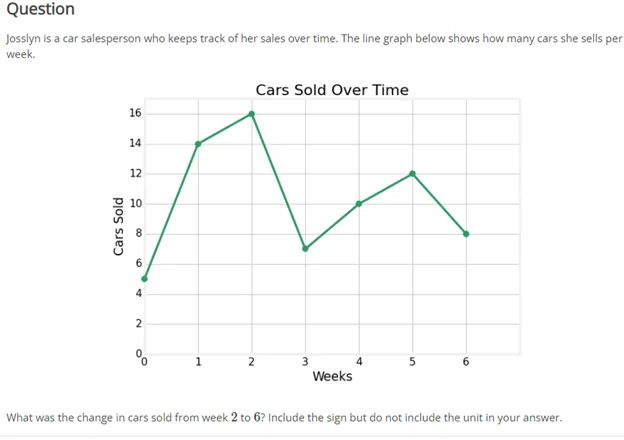
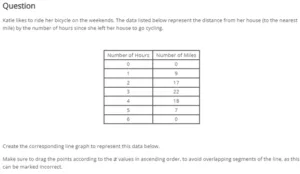
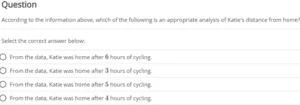
Description
Solution: MATH225N Week 2: More Displays of Data
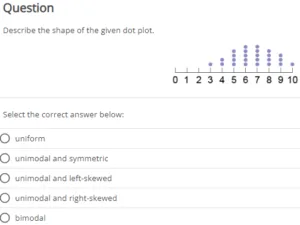
Question 1
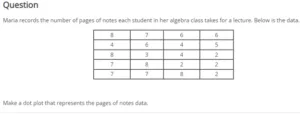
The number of books read in the last school semester is recorded for a random sample of 20 students in a high school. Below is the data.
| 8 | 6 | 3 | 6 |
| 8 | 3 | 8 | 4 |
| 5 | 3 | 8 | 8 |
| 7 | 7 | 7 | 3 |
| 5 | 6 | 8 | 7 |
Make a dot plot that represents the number of books data.
Answer
Question 2
A mathematics professor created a test that was supposed to be mostly easy except for two challenging problems. The scores of the students are shown in the dot plot below. What is the range of the scores? Do not include the percent sign in your answer……..Get the rest of MATH225N Week 2: More Displays of Data answer for just $8